15 Supply Chain KPIs and Metrics You Should Track to Improve Efficiency
Supply chain leaders need more than raw data to run efficient operations. They need the right KPIs and metrics to measure performance, spot risk, and make faster decisions. This article presents 15 essential supply chain KPIs from on-time delivery to disruption response time, and covers the tracking mistakes that undercut good data. It also looks at how supply chain analytics tools turn tracked data into action, and how Agistix consolidates that data into a single visibility layer.
In a volatile global environment marked by increasing customer expectations and inevitable disruptions, managing supply chains requires a fine-tuned blend of speed and accuracy. The margin for error is slim, and missteps can trigger a chain reaction of negative consequences.
The stakes have never been higher. A recent PwC survey revealed that only 37% of companies have changed their supply chain operating models in the past year despite increasing demands for agility and efficiency. Meanwhile, Gartner’s research emphasizes the need to invest in technological advancements to stay competitive, with 58% of business leaders identifying it as a top priority in the coming years.
Supply chain leaders need information that they can use to make improvements. Supply chain key performance indicators (KPIs) are a crucial part of this data-driven approach, offering the visibility and metrics necessary to make informed decisions, improve operations, and meet customer expectations.
What are Supply Chain KPIs and Metrics?
KPIs in supply chains are vital signs of an operation’s health. They offer a quantitative pulse check, highlighting strengths, diagnosing bottlenecks, and measuring progress toward business goals. The insights businesses gain from monitoring KPIs allow for proactive responses to disruptions, informed optimization strategies, and benchmarking against industry standards.
Metrics measure the operational activities and outcomes that feed into those bigger-picture KPIs. Where a KPI like on-time delivery shows whether the supply chain is meeting a strategic goal, a metric like average transit time per lane shows what’s driving that result day to day.
Tracking both KPIs and metrics matters for five reasons:
- Operational visibility: Metrics surface the granular activity happening inside a single process.
- Performance benchmarking: KPIs measure progress against a defined business goal or industry standard over time.
- Risk identification: Metrics catch anomalies early, before they compound into a KPI-level failure like a missed delivery window.
- Continuous improvement: Metrics reveal where to intervene, and KPIs confirm whether the intervention worked.
- Data-driven decision-making. Combining operational metrics with strategic KPIs gives leaders both the immediate detail and the broader context they need to act.
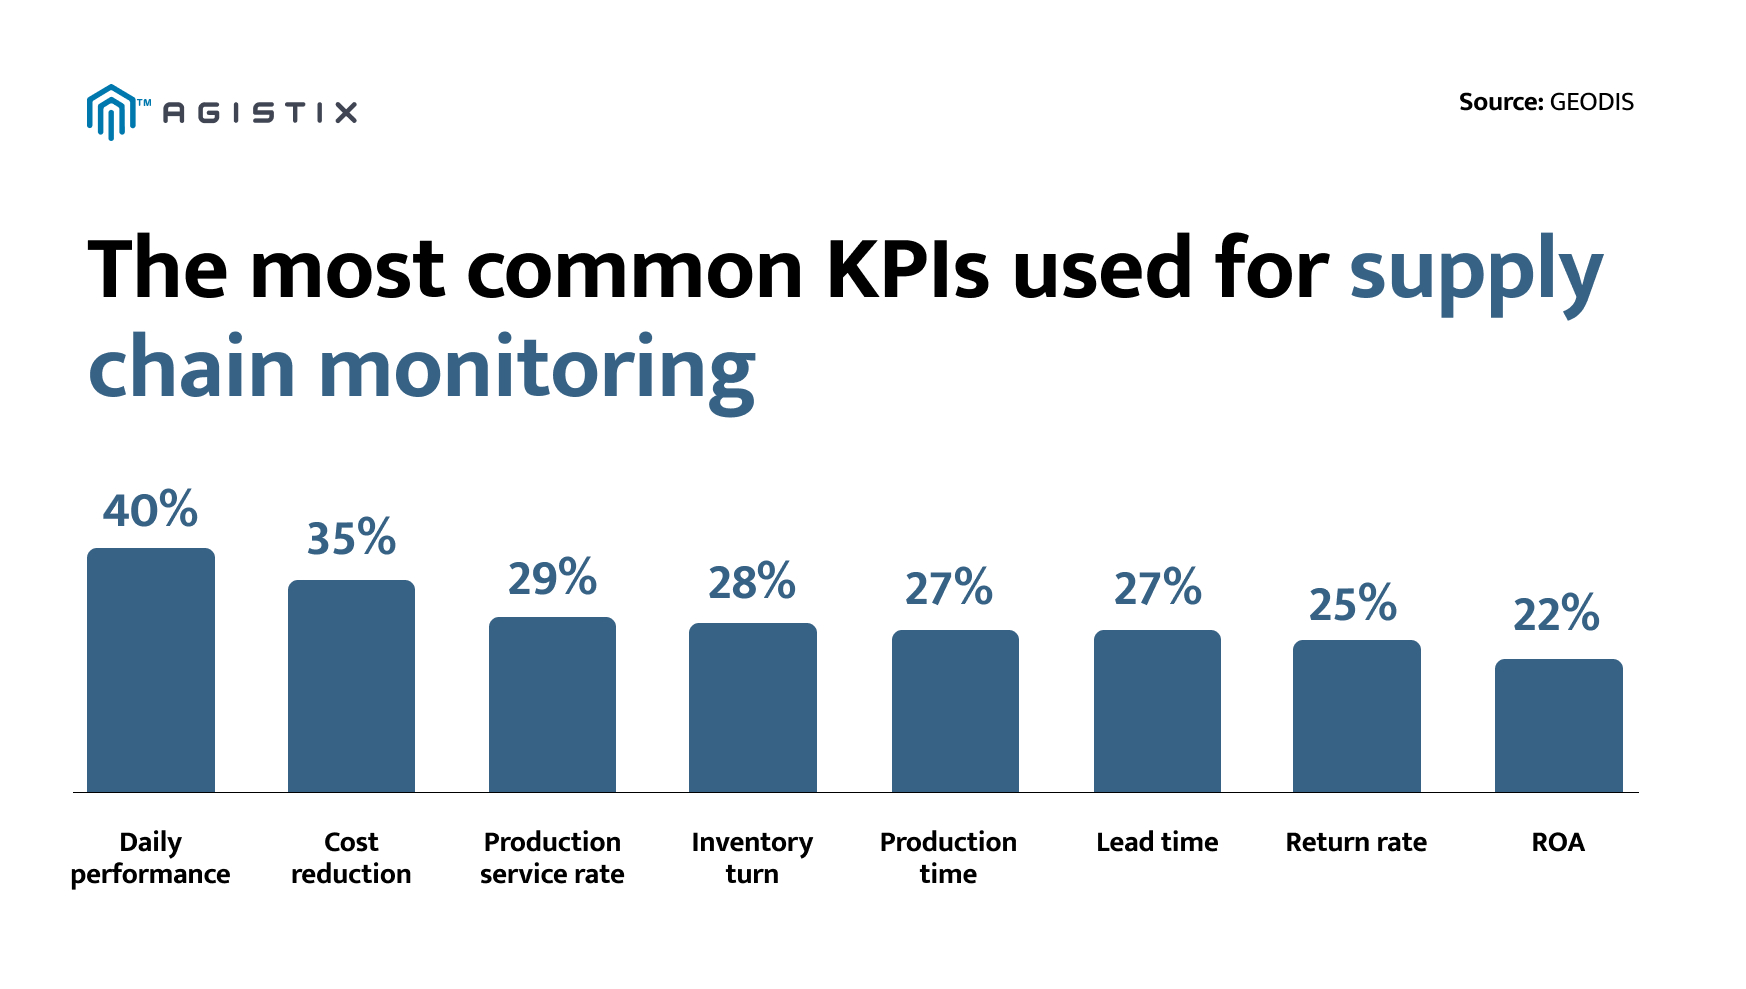
The most common supply chain management KPIs provide important evidence of a supply chain’s strengths, as well as where there is opportunity for improvement.
Why Tracking Supply Chain Metrics is Critical
Supply chains no longer move on predictable cycles. Conditions that used to shift over a quarter can change seemingly overnight. Manual tracking with periodic checks and static reports, can’t surface a problem fast enough for anyone to act on it. The pressure on today’s supply chains comes from several directions at once:
- Supply chain disruptions: Port congestion, weather events, and supplier failures can derail a shipment with little warning, and teams without current data find out too late to reroute or adjust.
- Transportation cost volatility: Fuel prices, carrier capacity, and spot market swings shift transportation costs week to week, making static budgets unreliable.
- Growing customer expectations: Customers expect delivery windows to hold and want visibility into their orders in real time, raising the bar for what counts as acceptable service.
- The need for real-time decision-making: Decisions made on last week’s data are decisions made too late, especially once a disruption or cost spike is already in motion.
Given this mix of complex risks, organizations increasingly rely on supply chain performance metrics and KPI tracking to keep operations under control rather than reacting to problems after they’ve already cost money.
Types of Supply Chain KPIs
Supply chain and logistics KPIs and metrics form a powerful source of information for understanding and improving day-to-day operations. Yet, with so many variables, businesses should understand the different types of KPIs and which are most useful for their own circumstances. For example:
- Monitoring KPIs are real-time metrics that track the ongoing performance of specific processes, providing immediate output feedback and identifying potential bottlenecks or disruptions. This includes tracking the order cycle time and the duration from order placement to delivery, which can reveal inefficiencies in order processing, inventory allocation, or transportation.
- Leading KPIs help monitor supplier performance ratings and provide insights into future trends and potential issues, assisting businesses to identify potential risks of delays or quality issues in advance.
- Lagging KPIs measure the total impact of supply chain activities, offering a broader view of performance over time.
Understanding the different categories of KPIs in the supply chain helps businesses build a comprehensive performance operations measurement system.
15 Essential Supply Chain KPIs and Metrics
KPI #1: On-Time Delivery (OTD)
In the age of Amazon, where next-day shipping is expected, on-time delivery (OTD) is a must for customer loyalty and brand reputation. A late delivery can quickly turn a happy customer into a frustrated one, leading to lost sales and negative reviews.
OTD is one of the most common transportation metrics and measures the percentage of orders delivered on or before the customer’s requested or promised delivery date. It’s a direct reflection of a supply chain’s reliability, but how can one ensure the supply chain consistently delivers on its promises?
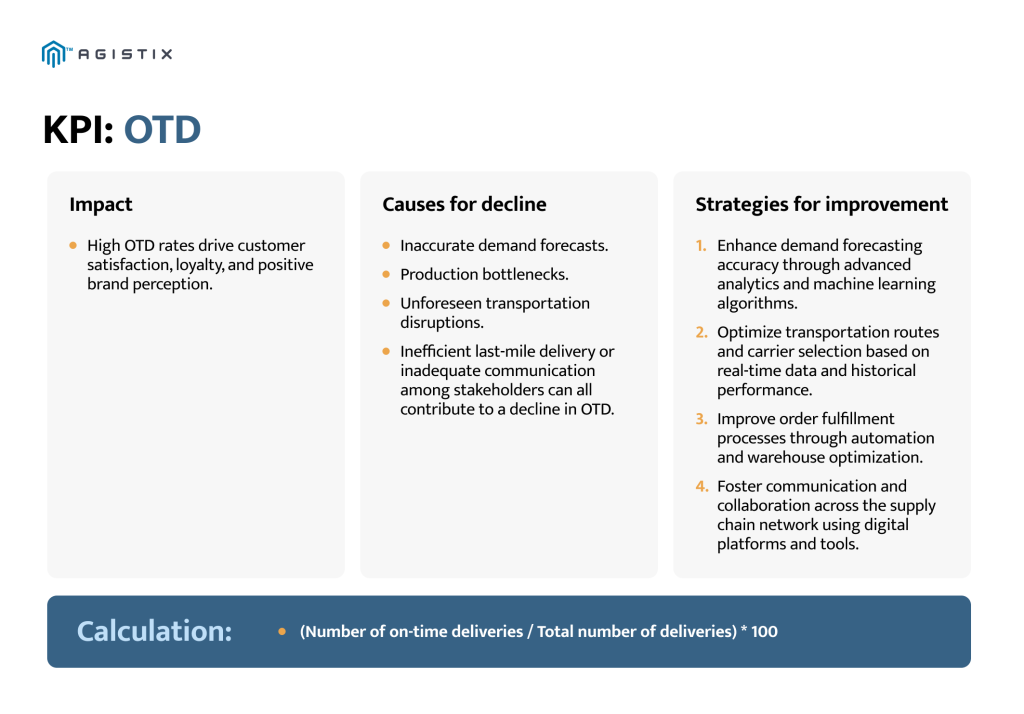
Actively monitoring OTD metrics, identifying root causes of delays, and implementing data-driven improvement strategies help boost customer satisfaction, reduce costs, and build a reputation for reliability.
KPI #2: Supplier On-Time Performance
Supplier on-time performance measures how consistently a supplier delivers goods or materials by the agreed date. A supplier that repeatedly under-delivers creates ripple effects across the rest of the operation, from delayed production runs to missed customer commitments.
Tracking this KPI gives buyers leverage to renegotiate terms, diversify sourcing, or flag a supplier relationship before it causes a significant downstream disruption. It also supports better production and delivery planning, since reliable supplier data feeds directly into how confidently a business can commit to its own customers.
KPI #3: Total Order Cycle Time (TOCT)
TOCT measures the average time it takes for a customer to receive their order after placing it, including the delivery time.
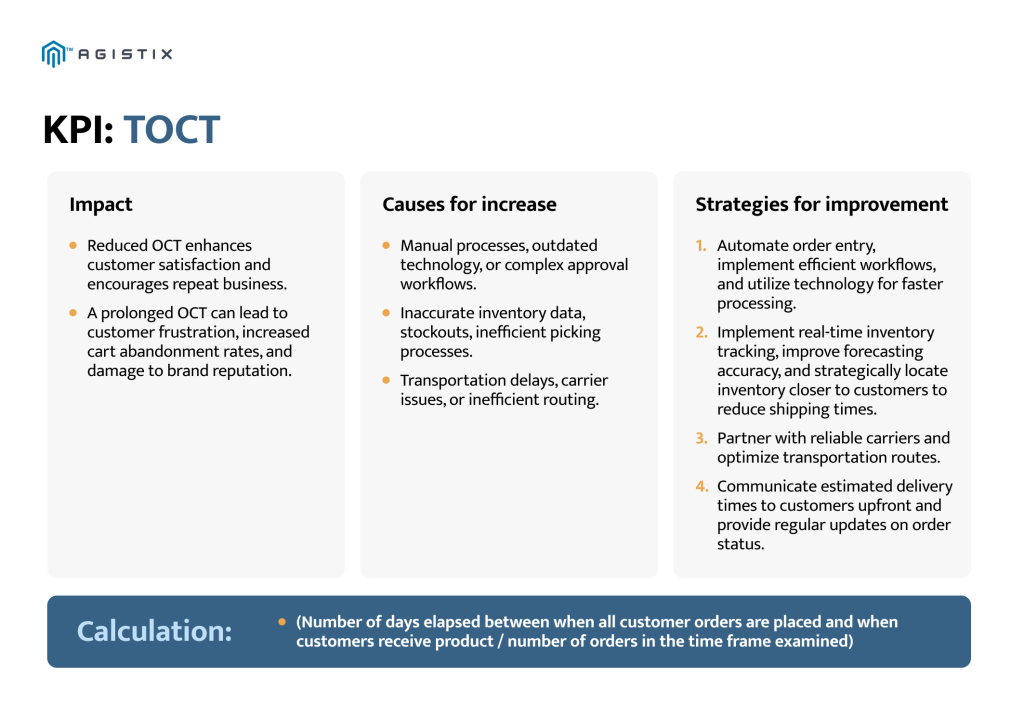
Reducing the total time it takes to process and deliver an order is a must for boosting customer happiness. Businesses that shorten this duration improve the customer experience, which in turn increases sales and profits.
KPI #4: Order-to-Cash Cycle Time (O2C)
Order-to-cash (O2C) cycle time measures how quickly an organization converts orders into cash, a vital indicator of a company’s financial health. This KPI measures the time it takes for a company to receive payment for an order after it has been shipped.
Day Sales Outstanding, or DSO, is a critical component of the O2C cycle, reflecting the average time it takes to collect payments from customers. A high DSO can indicate challenges in revenue collection and potential bad debts, impacting overall cash flow. By actively monitoring and managing DSO, along with the other components of the O2C cycle, businesses can optimize their financial performance and ensure a healthy cash flow.
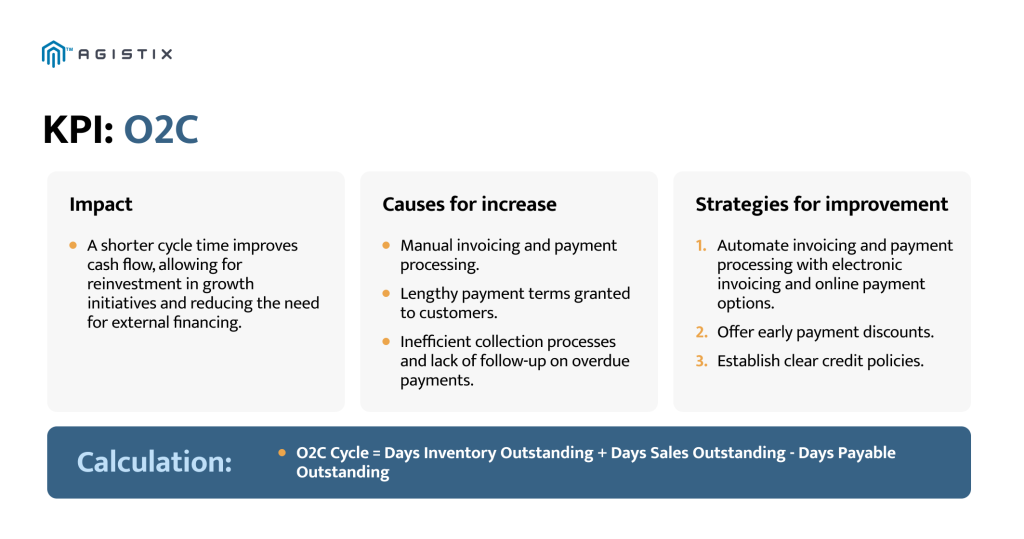
A reduced time in the O2C cycle indicates a productive supply chain. Enhancing billing, payment, and receivables processes can boost cash flow.
KPI #5: Routing Compliance (RC)
Routing compliance measures the percentage of shipments that adhere to the planned route and delivery schedule. It’s a key factor in on-time deliveries and overall transportation cost management.
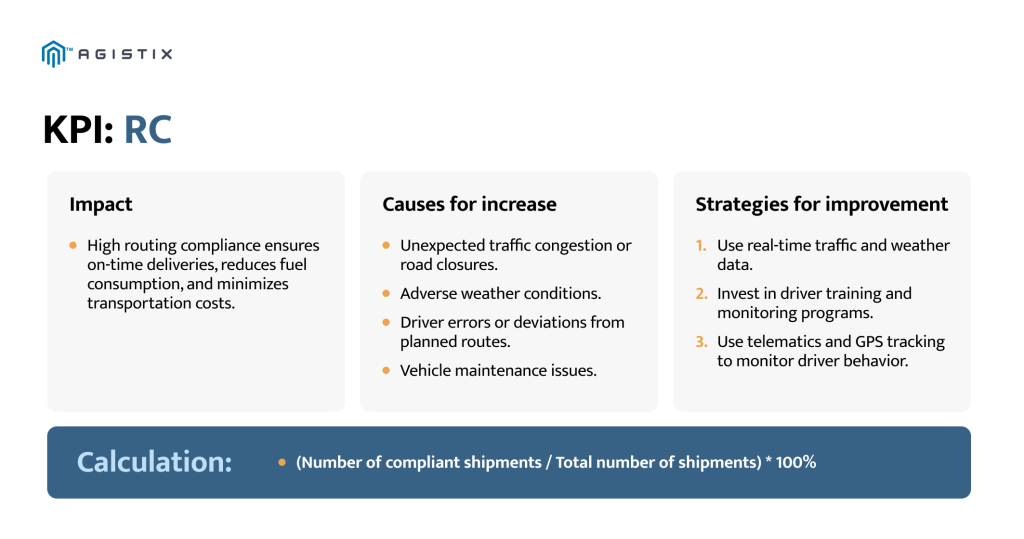
A company should adopt a forward-thinking attitude toward route planning and supervision to ensure high levels of routing compliance.
KPI #6: Shipment Visibility Rate
The shipment visibility rate measures the percentage of shipments a business can track in real time, across every carrier and mode. A low visibility rate creates blind spots, with shipments going dark between milestones and no way to confirm status until they arrive.
Improving this rate usually means consolidating tracking data from every carrier and mode into one feed, rather than checking separate carrier portals one by one. That consolidation is what makes end-to-end supply chain visibility possible, giving teams a single place to spot an exception or delay and act on it before it impacts the customer.
KPI #7: Predictive ETA Accuracy
Predictive ETA capabilities are offered by nearly all supply chain solution providers now, with platforms marketing the ability to forecast arrival times rather than rely on a carrier’s static schedule. But a predictive ETA is only useful if it’s accurate. Trusting an ETA that isn’t can be worse than not having one at all, since it creates a false sense of certainty.
Predictive ETA accuracy measures how closely a system’s forecasted arrival time matches the actual delivery time. Accuracy varies significantly by provider and by how far out the prediction is made. A forecast issued within hours of arrival is far more reliable than one issued at pickup, since more real-time data has accumulated by then. That variability is exactly why the accuracy of a predictive ETA needs to be measured and tracked before it’s trusted for operational planning.
KPI #8: Freight Cost Per Unit Shipped
The freight cost per unit shipped KPI determines the efficiency and cost-effectiveness of your transportation operations. By tracking this, companies can negotiate better rates with carriers and reduce overall shipping expenses.
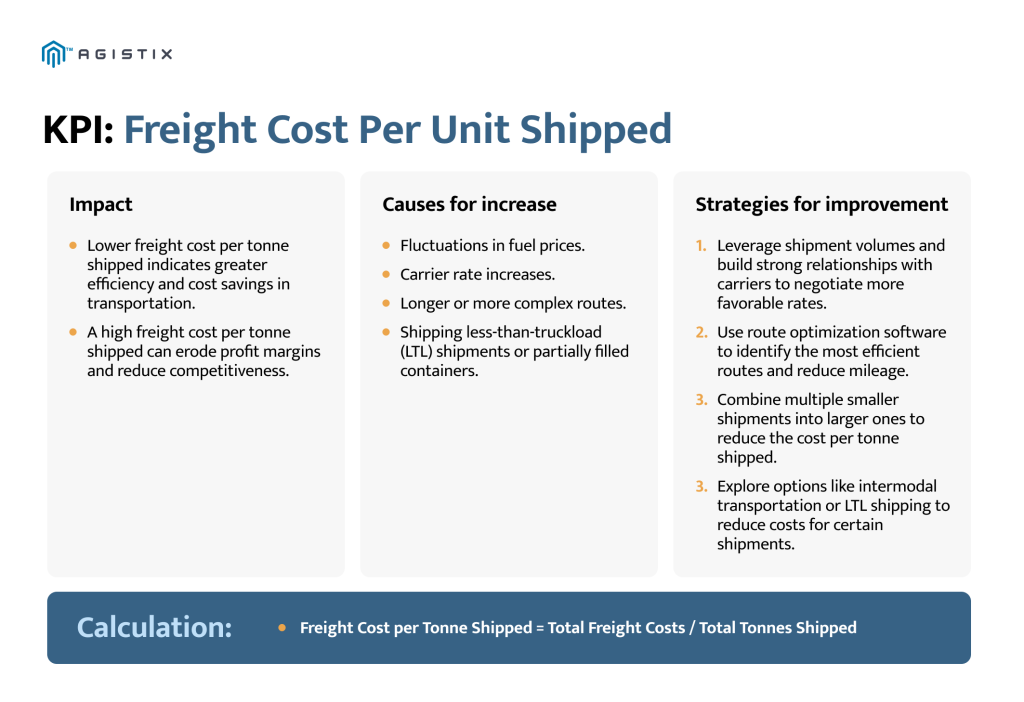
Tracking freight cost per tonne shipped is essential for optimizing transportation operations and maximizing profitability. By understanding the factors influencing this cost and actively implementing optimization strategies, businesses can achieve savings and boost efficiency, a significant aspect in the current market where transportation costs are on the rise.
KPI #9: Savings vs. List Rates (SvLR)
Savings vs. list rates is a KPI that measures a company’s ability to secure favorable pricing with carriers and logistics providers. It compares the actual rates a company pays for transportation and logistics services with the published list rates.
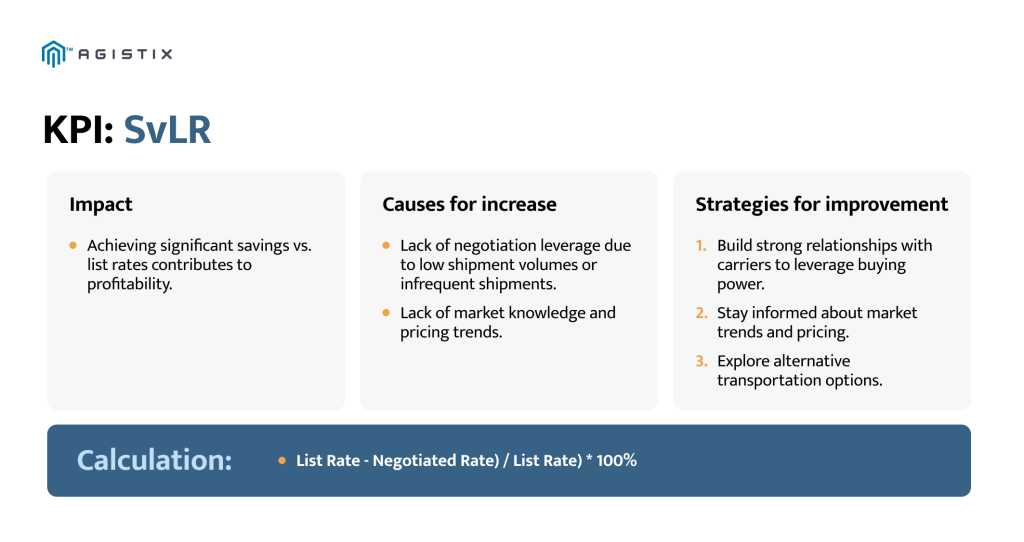
Companies can substantially lower transportation and logistics expenses through proactive negotiation and by securing advantageous rates.
KPI #10: Spot Quote Savings (SQS)
Spot quotes help seize opportunities for cost savings on ad-hoc or urgent shipments. This KPI is a critical freight metric and measures a company’s ability to use the spot market to its advantage.
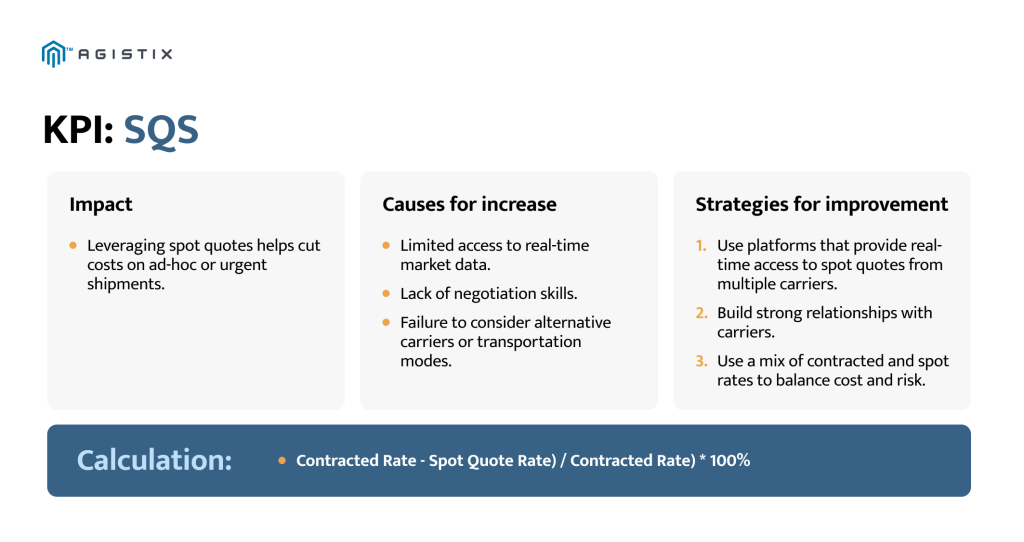
Spot quote savings are valuable for optimizing transportation costs, especially for businesses with flexible shipping needs. However, it’s important to use spot quotes strategically and balance them with contracted rates to ensure long-term stability and cost control.
KPI #11: Perfect Order Rate (POR)
The perfect order rate is the gold standard of supply chain efficiency. It measures the percentage of orders that are processed, fulfilled, and delivered without any errors, delays, or customer complaints.
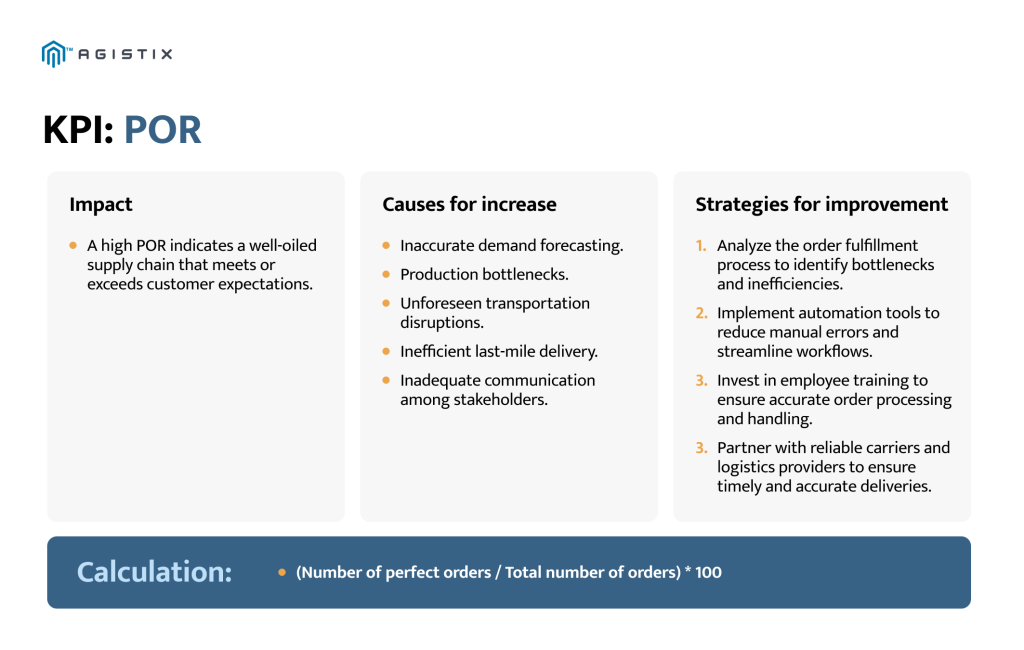
By diligently monitoring and optimizing POR, businesses can ensure a seamless customer experience, build trust, and drive revenue growth.
KPI #12: Freight Bill Accuracy (FBA)
Freight bill accuracy (FBA) measures the percentage of freight invoices that are accurate and error-free.
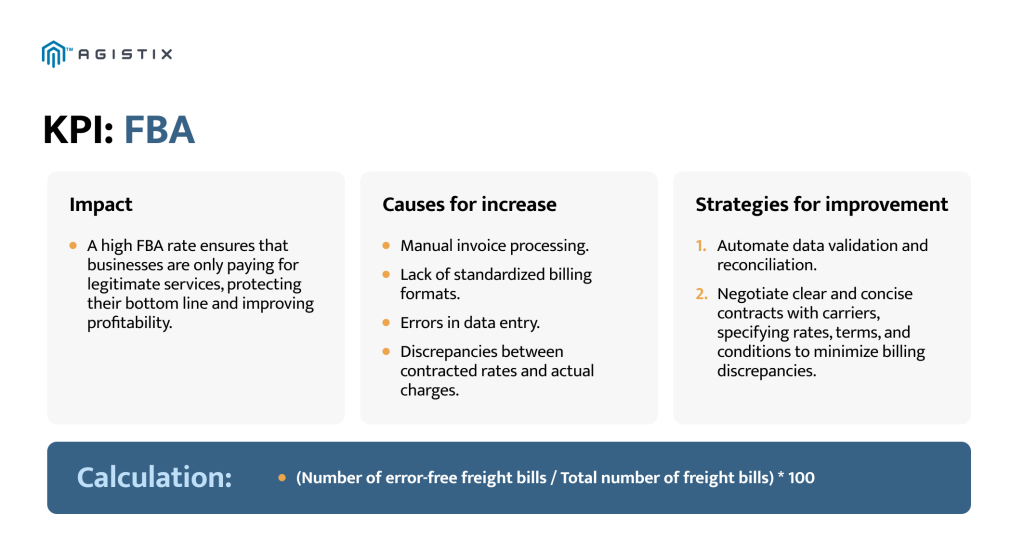
Businesses can avoid unnecessary spending by ensuring high freight bill accuracy, improving carrier relationships, and enhancing their overall financial performance.
KPI #13: Accessorial Fees as % of Freight Spend
Some accessorial fees should be accounted for at the rating and booking stage, since charges like liftgate service or residential delivery are known ahead of time and can be quoted upfront. The problem is when fees get added without notification or approval, like detention or reclassification charges often are once a shipment is already moving. Accessorial fees as % of freight spend measures how much of total freight spend comes from these unexpected surcharges, separating the fees anticipated at booking from the ones added afterward without notice.
Tracking which accessorials were anticipated versus which were added later supports both cost management and carrier rate compliance. It shows which fees are recurring rather than exceptional, giving shippers grounds to renegotiate contract terms, fix booking errors that trigger avoidable fees, or hold carriers accountable for charges that don’t match the shipment.
KPI #14: Gross Margin Return on Investment (GMROI)
With inventory management, simply tracking costs and sales isn’t enough. To truly calculate the effectiveness of inventory investment, a company needs GMROI, a metric that connects profitability to the capital tied up in stock. It shows which products generate profit and which simply take up storage space.
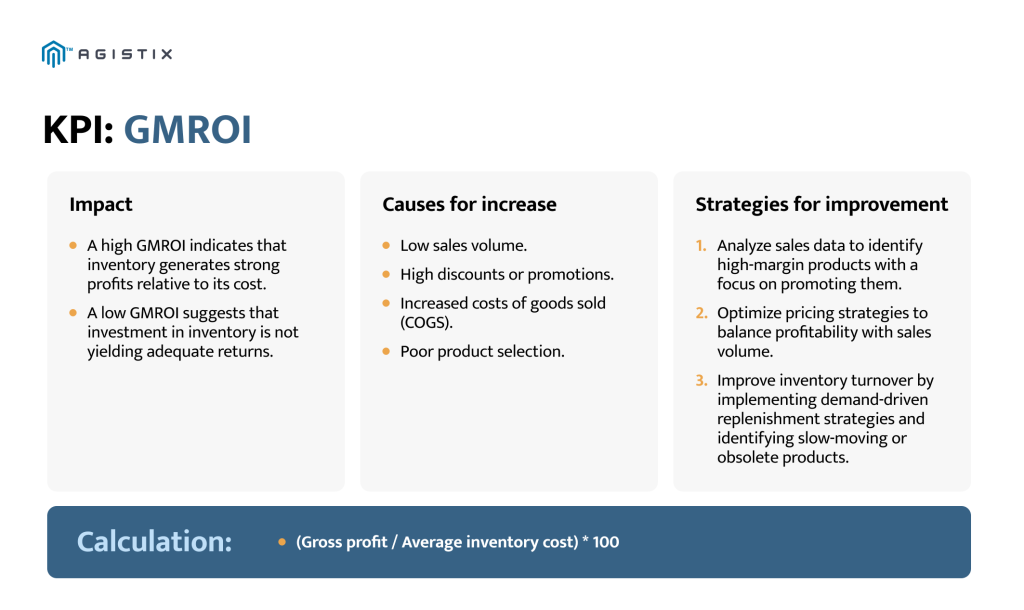
Proactively managing GMROI helps make insightful changes that turn inventory from a cost center into a profit generation opportunity.
KPI # 15: Supply Chain Disruption Response Time
Supply chain disruption response time measures how quickly an organization identifies a disruption and puts a corrective action in place, from a delayed shipment to a supplier outage. A fast response time limits how far a single disruption spreads before someone catches it.
Organizations with strong response times typically have real-time monitoring and clear escalation paths already in place, so the moment a disruption appears, the right person can act on it rather than discover it after the fact. Tracking this KPI puts supply chain resilience on the same footing as cost and speed.
Common KPI Tracking Mistakes
A KPI program can have accurate data flowing in from every system and still fail to move the needle, if nobody reviews and acts on that data. A few mistakes account for most of that gap:
- Tracking too many metrics. When a team monitors dozens of metrics at once, the KPIs that matter most often get lost in the noise.
- Focusing only on cost KPIs. Cost matters, but a program built entirely around cost misses service, quality, and risk indicators that predict bigger problems down the line.
- Measuring without taking action. A KPI that gets reported but never changes any operational process likely isn’t adding much value.
- Lack of visibility across partners. KPIs built on incomplete data, missing carrier or supplier inputs, create a distorted picture of actual performance.
- Poor data quality. Inconsistent formats, duplicate entries, and manual data entry errors undermine every KPI calculated from that data.
Supply chain analytics platforms address each of these by centralizing data from every partner and system into one source, standardizing how it’s measured, and surfacing the specific KPIs that matter most for a given operation, rather than every metric a business could possibly track.
Supply Chain Monitoring and Analytics Tools That Drive KPI Performance
KPI programs usually run on two kinds of systems working together. Tracking systems capture what’s happening to a shipment as it moves. Performance indexes take that raw activity and turn it into indicators, like on-time delivery or order fill rate, that can be tracked and benchmarked over time.
- Tracking systems: GPS, RFID, and IoT sensors monitor the real-time movement of goods, delivering accurate information on location, ETA, and potential delays. Advanced systems go further, surfacing carrier performance, route optimization opportunities, and even the environmental impact of a shipment.
- Performance indexes: Indexes built around KPIs like on-time delivery, order fill rate, inventory turnover, and customer satisfaction reveal trends, measure the impact of process changes, and benchmark performance against industry standards.
Supply chain analytics is what turns the raw output of tracking systems and performance indexes into a user-friendly and actionable dashboard. Rather than waiting for a monthly report to surface a problem, analytics can:
- Spot a KPI drifting in the wrong direction, like freight cost per unit creeping up over several weeks
- Detect risks earlier, such as a carrier’s on-time performance sliding before it triggers a string of late deliveries
- Optimize transportation routing and mode selection based on current cost and capacity data
- Enhance visibility across partners, carriers, and internal systems
- Support faster decision-making by putting the relevant KPI in front of the person who can act on it
A logistics team can have every KPI on this list tracked accurately and still lose money if no one connects the metric to the reason behind it. Making that connection, from a tracked number to a specific decision, is where supply chain dashboards and advanced analytics provides the most value.
Agistix: Empowering Supply Chain Performance Through Data-Driven KPIs
Effective supply chain management relies on visibility into in-transit, transactional, financial, and data ownership, with KPIs as success indicators. Agistix’s comprehensive visibility platform empowers businesses to harness the full potential of their data, turning raw KPIs into actionable insights that drive operational excellence.
Agistix consolidates real-time data across the supply chain, providing a unified 360-visibility view. The platform centralizes real-time tracking data across all modes and carriers, providing comprehensive visibility into inbound, outbound, and third-party shipments. Integrating financial data with real-time tracking enables accurate freight spend forecasting, routing guide compliance, and comparing estimated versus actual costs easily.
Ready to take your supply chain to new heights? Experience the power of data-driven decision-making with Agistix — request a free demo.
Frequently Asked Questions
Why are KPIs important in supply chain management?
KPIs give teams measurable insight into how well the supply chain is performing. They help identify inefficiencies, track progress toward goals, support data-driven decisions, and align stakeholders around performance expectations.
How can analytics improve supply chain KPI performance?
Analytics improves supply chain KPI performance by turning tracked data into a specific action instead of letting it sit in a report. It can catch a KPI moving in the wrong direction, like a rising freight cost per unit, before it turns into a bigger budget problem, and it can flag a carrier’s on-time performance sliding before that turns into a string of late deliveries.
Applied to forecasting, analytics also sharpens accuracy on demand, freight spend, and delivery windows, giving teams a better planning input than a static schedule provides. Combined with real-time visibility across partners and carriers, analytics puts the relevant KPI in front of the person who can actually act on it, instead of waiting for the next scheduled report.
How often should supply chain KPIs be reviewed?
It depends on the KPI. Time-sensitive metrics like on-time delivery or tender acceptance should be reviewed daily or weekly. Strategic metrics like order-to-cash cycle time or inventory turnover are often reviewed monthly or quarterly.
How do real-time visibility tools support KPI tracking?
Visibility tools automatically gather data from carriers, suppliers, and internal systems. This allows you to track key metrics in real time, reducing manual reporting and helping you respond to issues faster.
Can supply chain KPIs help improve customer experience?
Absolutely. KPIs like order accuracy, on-time delivery, and lead time variability directly impact customer satisfaction. Monitoring these metrics helps teams stay ahead of issues that affect service quality.
